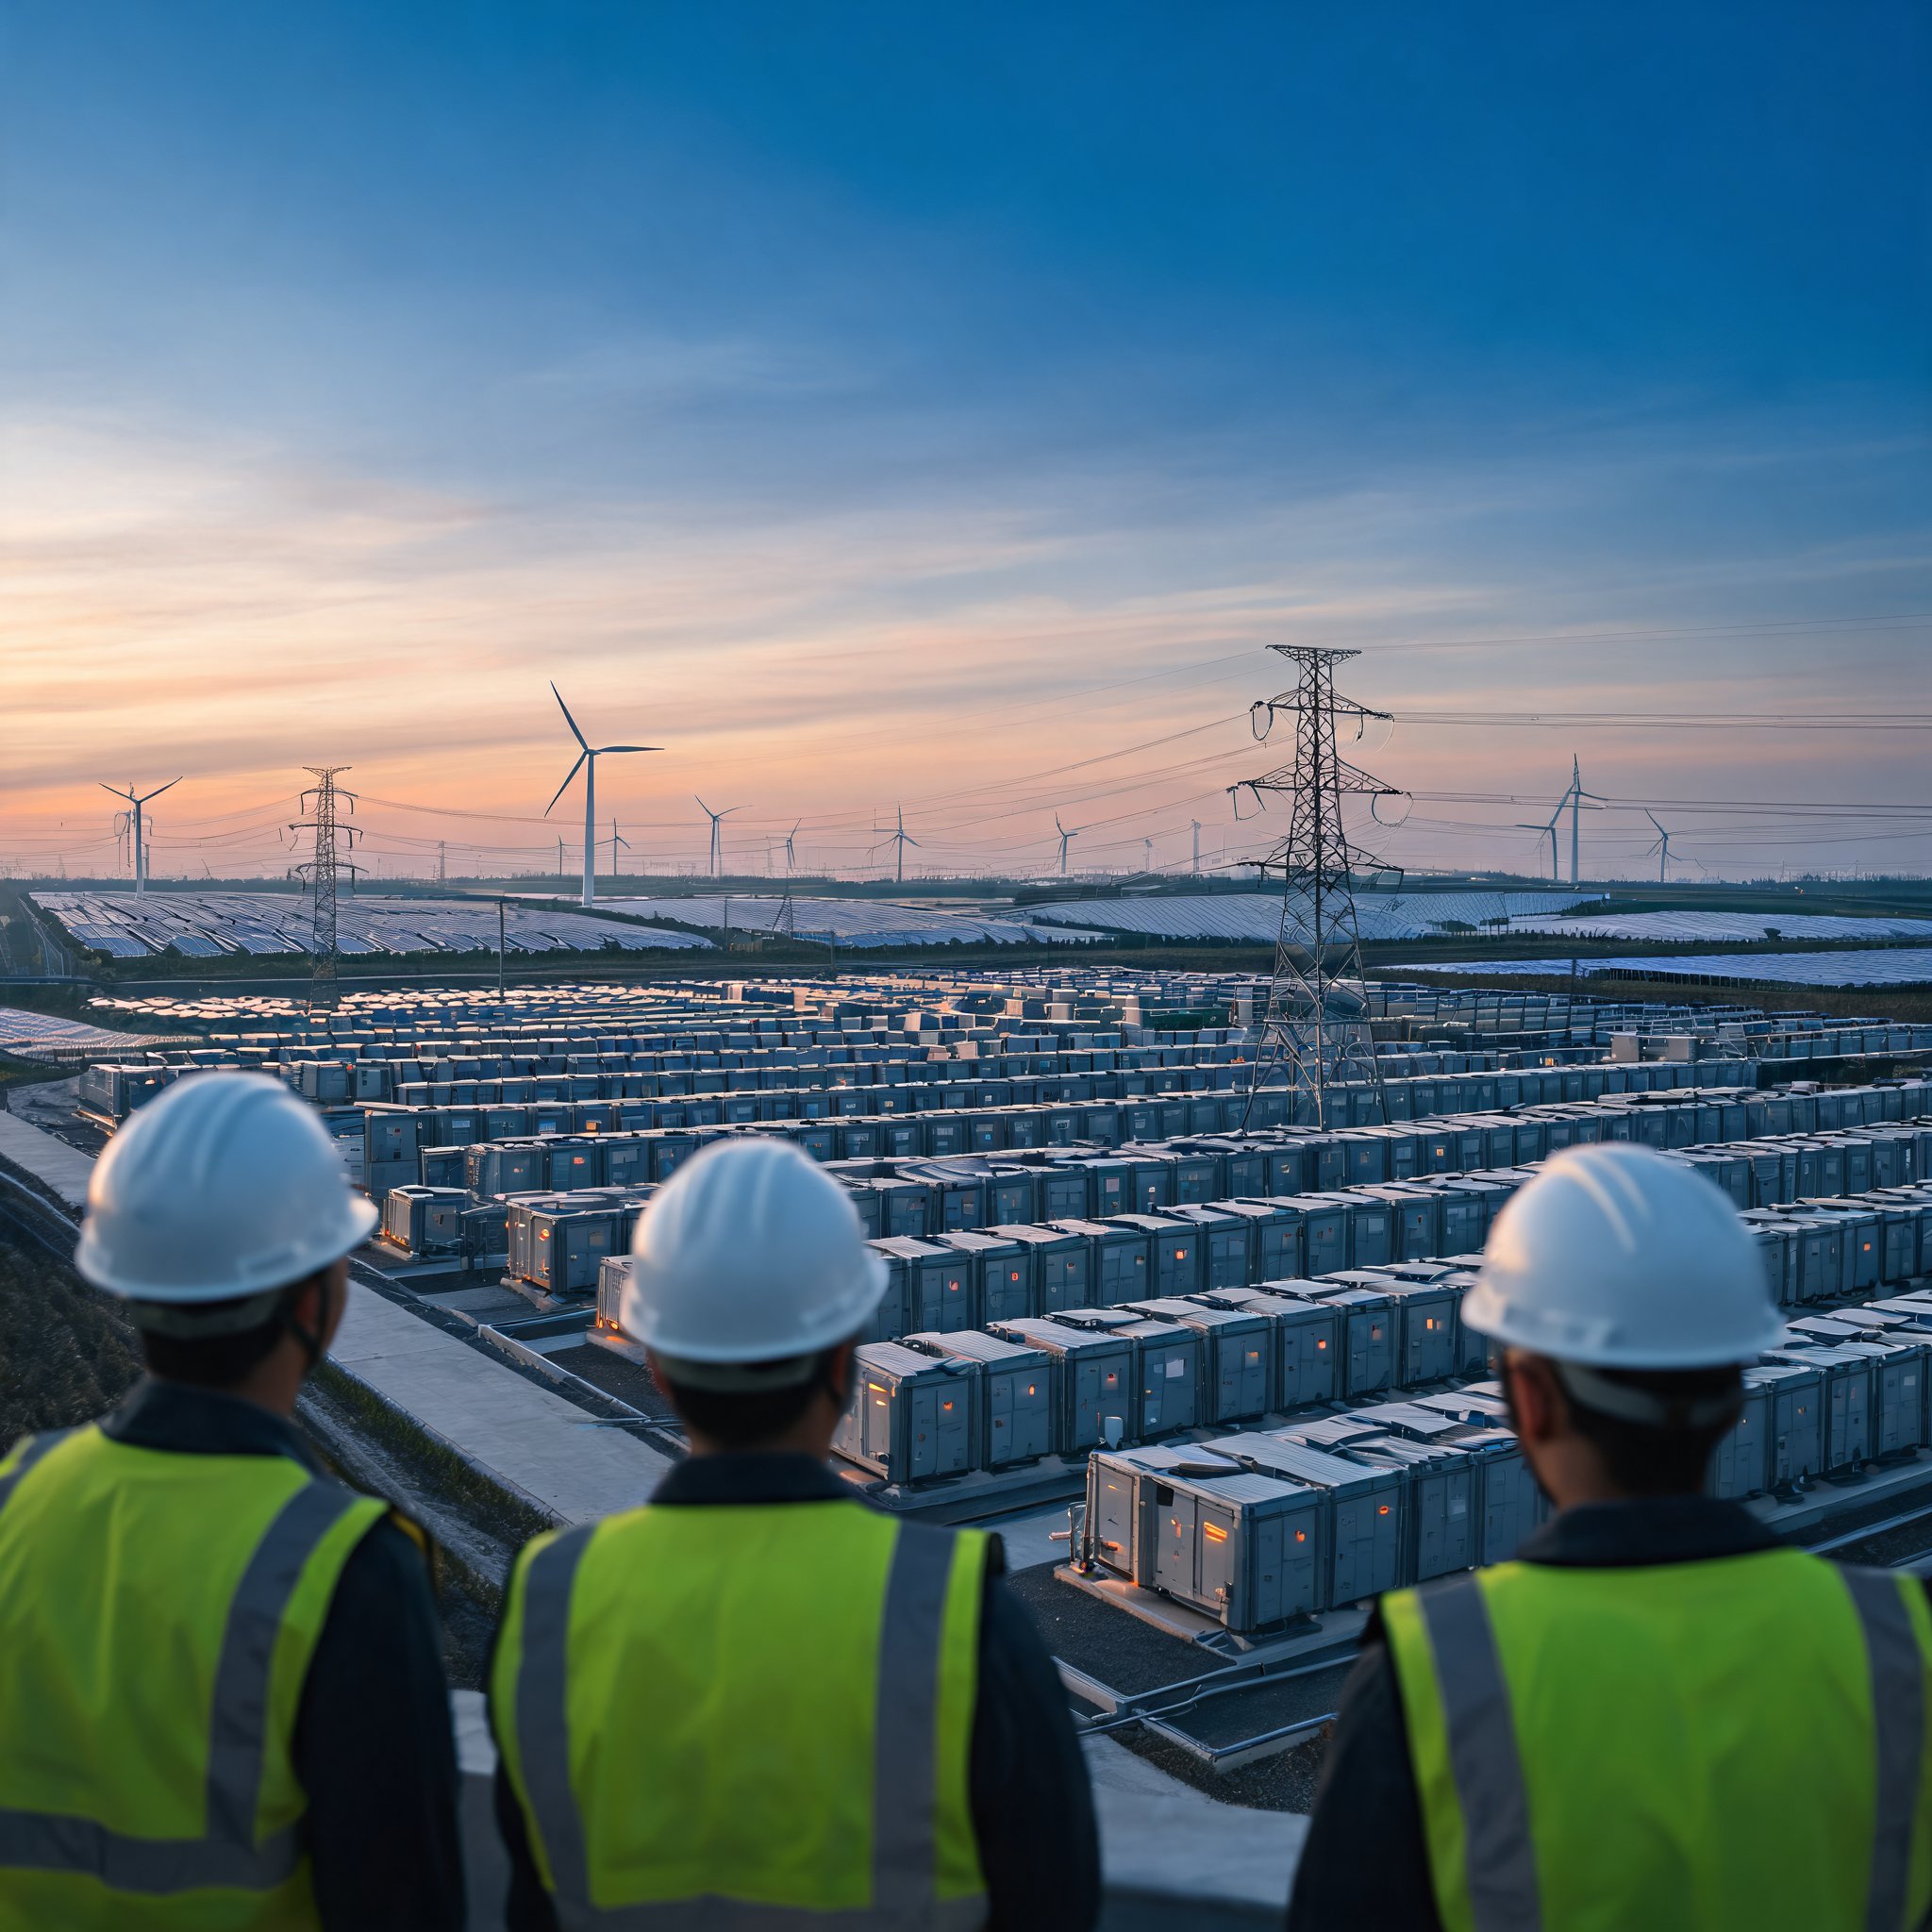
China’s operational new-type energy storage capacity reached 167 GW/435 GWh at the end of September 2026, up 63% year on year, according to National Energy Administration figures presented at its quarterly press conference on 30 October. The category covers electrochemical, compressed-air and other emerging storage systems, but excludes conventional pumped hydro.
At the end of 2025, the fleet stood at 135.93 GW/351.12 GWh. The latest figures therefore imply a net addition of about 31 GW/84 GWh during the first nine months of 2026. That is a substantial build-out, but the NEA data also point to changes in how storage is configured and used, not only how much is installed.
Duration and utilization move higher
Average storage duration rose to 2.61 hours, about 0.27 hours more than a year earlier. Equivalent utilization reached roughly 915 hours over the nine-month period, around 10 hours above the same period in 2025. These are modest improvements, but they matter because they indicate that additions are being accompanied by gradual operational adjustments. The utilization figure covers nine months and should not be treated as an annual total without further data.
Annualizing the nine-month utilization figure would be misleading because storage dispatch varies with seasonal demand, renewable output and grid conditions. Even so, the combination of longer average duration and higher equivalent utilization supports the NEA’s characterization of gradual changes in system configuration and use. It does not show that every project is improving, nor that utilization is uniform across provinces or technologies.
The figures do not by themselves establish project profitability or the value of storage to the grid. They do show that the average system is lasting longer and being called on somewhat more, which is consistent with a market that is maturing beyond simple capacity growth.
Renewable growth creates flexibility demand
China’s combined wind and solar generating capacity exceeded 2.01 TW at the end of September, accounting for about 48.7% of total installed power capacity. As variable renewable capacity expands, storage is increasingly needed to absorb surplus electricity, shift generation to periods of higher demand and provide fast-response grid services. The NEA attributes the rapid development of new-type storage to government policies, technological innovation, industrial supply chains and growing demand for flexibility.
Those drivers help explain why storage has scaled quickly. They also set the test for the next phase: more renewable capacity raises the need for flexibility, but the economic return for storage depends on market rules, dispatch practices and project performance.
Market structure is changing
Official 2025 figures showed that independent energy storage facilities made up 51.2% of cumulative new-type storage installations. Projects rated at 100 MW or above represented 72% of installed capacity, while systems with durations of at least four hours accounted for 27.6%. Lithium-ion batteries remained dominant at approximately 96% of installed new-type storage capacity, although compressed-air, flow batteries and other technologies are gradually expanding their presence.
These shares suggest a fleet still dominated by shorter-duration lithium-ion systems, alongside a smaller but visible segment of larger and longer-duration projects. Market reforms are expected to reinforce the shift toward independent operation. China has been developing arrangements that allow independent storage operators to earn revenue from electricity trading, ancillary services and capacity remuneration, gradually reducing reliance on mandatory storage requirements tied to renewable projects. The direction of reform is clear, but the actual revenue outcomes are not established by the NEA data alone.
Targets and regional evidence
Under the 15th Five-Year Plan for power system development, China targets 300 GW of new-type energy storage by 2030, with greater emphasis on longer-duration systems, grid-forming capabilities and improved operational efficiency. This is a target, not an achieved outcome, and it implies continued expansion alongside a change in the quality and capability of the fleet.
Regional experience shows how storage can contribute in renewable-rich grids. In western Inner Mongolia, the grid operator reported 20.23 GW/70.47 GWh of operational storage capacity in October. During emergency dispatch operations, storage supplied up to 12.25 GW, equivalent to 33% of the grid’s electricity demand at that time. The example illustrates short-term balancing capacity in a high-renewable system, though it reflects a specific grid and dispatch event rather than a general performance benchmark.
What the numbers show, and what they do not
The 167 GW figure confirms rapid scale-up. The duration and utilization gains point to incremental improvement in system use. The 2030 target and market reforms indicate the intended direction: more independent storage, longer durations, grid-forming capability and greater operational efficiency. At the same time, the data have clear boundaries. The capacity total excludes pumped hydro, the utilization figure covers nine months, and the structural shares cited are for 2025. Capacity growth alone does not prove firm capacity, profitability or full integration into grid operations. The 96% lithium-ion share also means technology diversification remains limited relative to the fleet’s scale.
For other countries expanding wind and solar, China’s deployment offers experience in large-scale storage manufacturing, grid integration and centralized dispatch. How far that experience travels will depend on local market design and grid conditions. The next test is whether revenue arrangements, longer-duration projects and operational practices can keep pace with the build-out.